Activity Diagram
Activity diagrams are graphical representations of workflows. They primarily show the overall flow of control, but they can also include elements showing the flow of data.
The complete workflow in a diagram is called an activity.
Diagram Model
Name |
Graphical Representation |
Description |
|---|---|---|
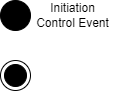
Entry and Exit |
|
|
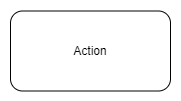
Action |
|
|
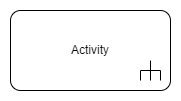
Activity |
|
This element refers to another activity diagram. Splitting the content into several diagrams can help to reduce the complexity and avoid repetitions. |
Decision |
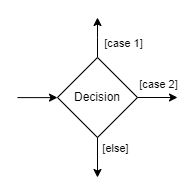
|
|
Events |
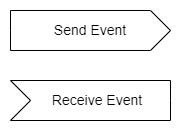
|
Events can be sent and received in the same or in different diagrams. |
Fork and Join |

|
Forks and joins are used to model asynchronous behaviour. |
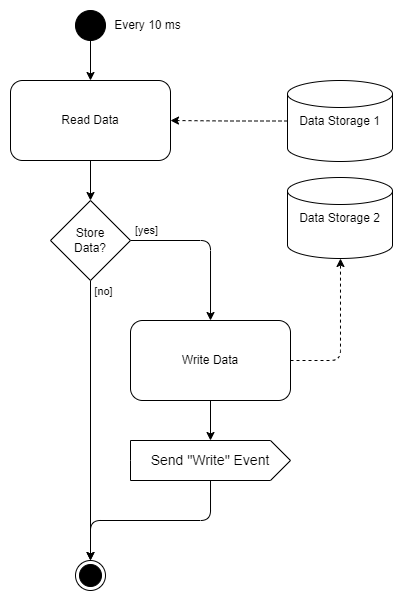
Example